 Angryturtle
See what your Google profile actually earns you.
Insights & Performance pulls your real Google Business Profile metrics — profile views, phone calls, direction requests and website clicks — and turns them into a trend you can act on. See your branded-vs-discovery split, compare any two date ranges, and export a month-on-month search breakdown. Google's performance data lags roughly a month, so we're honest about the window rather than pretending it's live.
In brief
It tracks the real GBP performance metrics Google exposes — profile views (impressions), phone calls, direction requests and website clicks — along with your action rate and the branded-vs-discovery split of how people found you.
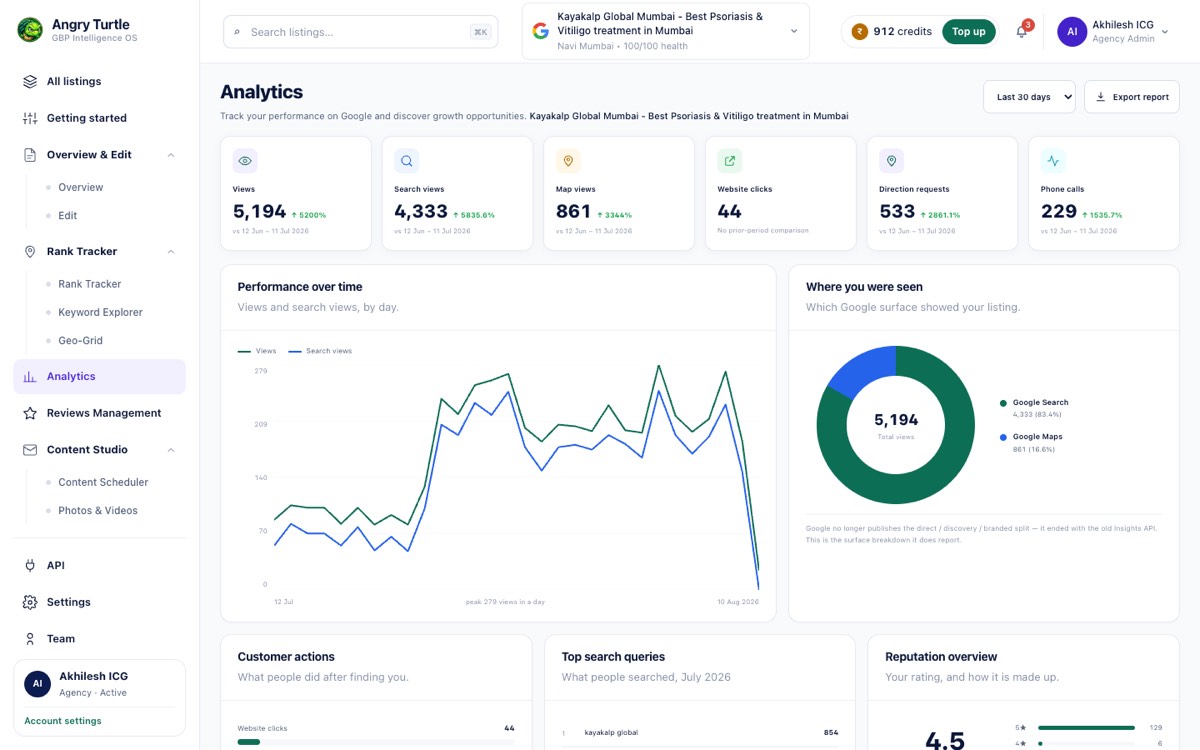
Insights & Performance — from the live Angryturtle console.
How Insights & Performance works.
Connect
Link your Google Business Profile — Angryturtle syncs your real performance metrics.
Compare
Pick any date range and read views, calls, directions and clicks against the prior period.
Export
Download the month-on-month search breakdown and branded-vs-discovery split for reporting.
What's inside.
The building blocks that make this module work.
Who it's for.
Owners proving that profile work is turning into real calls and directions.
Agencies pulling clean MoM metrics for every client report.
Multi-location brands comparing discovery demand across outlets.
The screen most owners open and then close again
A physiotherapy clinic in Indiranagar, Bengaluru, ran three Google posts a month for a year and never once looked at what those posts did to calls. The owner's logic was reasonable enough: the phone rang sometimes, business was fine, why dig further. Then a new clinic opened two lanes away and the calls thinned out over eight weeks, slowly enough that nobody noticed until a slow Tuesday turned into a slow month. Insights & Performance exists for exactly that gap — the period between "something changed" and "I know what changed," which is usually where a business loses the most ground because nobody was watching the number that would have told them sooner.
The four numbers that matter — profile views, phone calls, direction requests, website clicks — are not interesting on their own. A view is not a customer. What's actually diagnostic is the ratio between them, and how that ratio moves. Rising views with flat calls means people are seeing the listing and not acting on it, which usually points at photos, hours, or a category that doesn't match what they searched for. Falling views with flat calls means fewer people are finding the listing at all, which is a different problem with a different fix — one lives in Rank OS, the other lives in the Demand Clusters read of what people are actually searching.
Reading the branded-versus-discovery split without fooling yourself
Branded searches — people typing your business name — will always look healthy if you've been open a while and have regulars. That's not a signal of growth, it's a signal of existing loyalty holding steady. The number worth watching is discovery: people who found you through a category or service query without knowing your name yet. A clinic whose branded searches are flat but whose discovery searches are climbing is actually winning new entity authority in its area. A clinic where discovery is flat or falling is invisible to anyone who isn't already a customer, no matter how good the branded number looks.
A false alarm worth naming up front: a single bad week, especially around a festival or a monsoon washout in a service-area business, is noise, not a trend. Google's own performance data lags by roughly a month, so a dip you notice today already happened weeks ago, and the fix for a lag like that is a custom date-range comparison against the same period last year or last quarter, not a panic reaction to last Tuesday.
What a healthy month looks like next to an unhealthy one
Put two months side by side and the difference is usually about movement, not size. A healthy month has views, calls and directions rising or falling together, roughly in proportion — that's a listing behaving the way you'd expect it to. An unhealthy month has one number moving alone: views up while everything else sits flat, or calls dropping while views hold steady. The second pattern is the one worth acting on, because it means the top of the funnel is fine and something further down is broken — a wrong phone number, hours that don't match reality, or a category mismatch that gets someone to click through and then realise this isn't quite what they needed. A single number moving on its own is a louder signal than the whole set drifting together, even when the drift looks scarier on a graph.
A worked read: a diagnostic lab in Ahmedabad
Picture a diagnostic lab in Navrangpura, Ahmedabad, running home sample collection alongside its walk-in centre. Profile views were up 22% quarter over quarter, which looked like good news until the owner pulled the month-on-month search breakdown export and saw that direction requests hadn't moved at all — people were finding the listing and not planning a visit. Website clicks, on the other hand, had climbed sharply. That combination usually means the audience wants to book online rather than walk in, which for this lab meant the fix wasn't more visibility, it was making the online booking link impossible to miss on the profile itself — a change that runs through Edit Location, not through Insights. The metrics didn't hand over the fix directly. They ruled out three wrong guesses and left one right one.
A second decision this data actually settles
There's a recurring argument inside multi-location businesses about which outlet needs the marketing budget this quarter, and it usually gets settled by whoever argues loudest rather than by the numbers. Comparing the branded-versus-discovery split across locations settles it more honestly: a location with strong branded search and weak discovery has a loyal base but isn't winning new customers, while a location with the reverse pattern is attracting new people but hasn't built repeat demand yet. Those need different fixes — the first needs more posting and category work to get found, the second needs the kind of reputation work Reviews & Brand is built for, since repeat business tracks with trust more than with visibility. Treating both locations the same because they're both "underperforming" wastes budget on the wrong lever at whichever one gets it wrong.
Where this doesn't help
Insights & Performance reads what Google's own Performance API exposes for the profile — it does not see website analytics, ad spend, in-store footfall, or calls that came through a number printed on a hoarding rather than the Google listing. If a business relies mainly on WhatsApp enquiries or a call centre number that isn't the one attached to the profile, this dashboard will systematically understate real demand, and no amount of staring at the export will fix that; it needs to be paired with whatever the business already tracks off Google. It also won't tell a multi-location brand which single location is dragging down an average — for that, the comparison has to happen at the Agency OS portfolio level, filtering listings individually rather than reading one aggregate number. And it measures what happened, not why an AI-generated answer chose to mention a competitor instead — that's a separate, structural question the measuring AI search visibility pillar covers in more depth than a performance dashboard ever could.
What it feeds
Freshness is one-fifth of the Rank OS score, and Insights is the evidence that freshness work is landing — a post that doesn't move views probably wasn't the right post. The branded-versus-discovery split is also the first clue that a demand cluster is scaling before the keyword volume itself catches up, since discovery searches often rise a few weeks ahead of a cluster getting flagged. And because the numbers here are first-party and GBP-native rather than modelled, they're the honest check against everything else the platform reports — including Geo-Grid claims about where you rank, citation fixes meant to lift trust, and local ranking factors generally, none of which mean much if the ranking isn't converting into calls and directions. For agencies, the same month-on-month export becomes the backbone of a white-label report a client can read without needing an explanation, and for anyone learning to read the raw numbers for the first time, the reading GBP performance data guide is a reasonable place to start before diagnosing anything.
If there's one habit worth building from this page: check the date range before believing the number. A month-old lag hiding inside a "last 7 days" view has talked more owners into the wrong fix than any single bad metric ever has.
Insights & Performance — questions, answered
The rest of the platform.
Rank OS Scoring
One transparent 0–100 score, split into the 5 weighted levers that move the map pack — with the top 3 fixes ranked by expected point lift.
Explore Rank OS ScoringGeo-Grid Rank Maps
A colour-coded grid showing your true rank at every point around your business — with a pin checker for any pincode and a rank tracker for every keyword.
Explore Geo-Grid Rank MapsAI Reviews + Virtual CMO
On-brand, one-click AI replies to every review — plus a Virtual CMO grounded in your own data, and a Brand Identity-vs-Image gap read that shows how customers really perceive you.
Explore AI Reviews + Virtual CMONAP & Citation Intelligence
A live directory-presence matrix of every listing that has your business wrong — with duplicate detection, missing-citation gaps and a prioritised fix list.
Explore NAP & Citation IntelligenceOne-Click Google Posting
Write once and publish an offer, event or update across all your listings on a schedule — a freshness signal that feeds your Rank OS score.
Explore One-Click Google PostingCompetitor Intelligence
A standardised view of your top-5 local rivals — ratings, review volume and the Us-vs-Competitor citation landscape — with the gaps you need to close.
Explore Competitor IntelligenceDemand Clusters & Momentum
Industry-aware keyword clusters with a momentum read and demand sizing, built from your own GBP data.
Explore Demand Clusters & MomentumAsk Maps / AIO Readiness
A per-listing question bank and visibility checks that show if your profile is a citable AI answer.
Explore Ask Maps / AIO ReadinessEdit Location (Write-Back to Google)
A full GBP editor with a live "how it looks on Google" preview — every change pushes straight to Google.
Explore Edit Location (Write-Back to Google)Brand Identity vs Image
Your canonical brand story set against how reviews say customers really see you — plus the gap and the fix.
Explore Brand Identity vs ImageAgency OS
Multi-tenant, white-label local SEO with roles, metered credits, client portals and a full API.
Explore Agency OS